Requirements
This tutorial will show you how to monitor your BBU/RU and access radio / core networks logs (and more) on the Rapid.Space panel.
Monitor your BBU - Monitor Setup URL
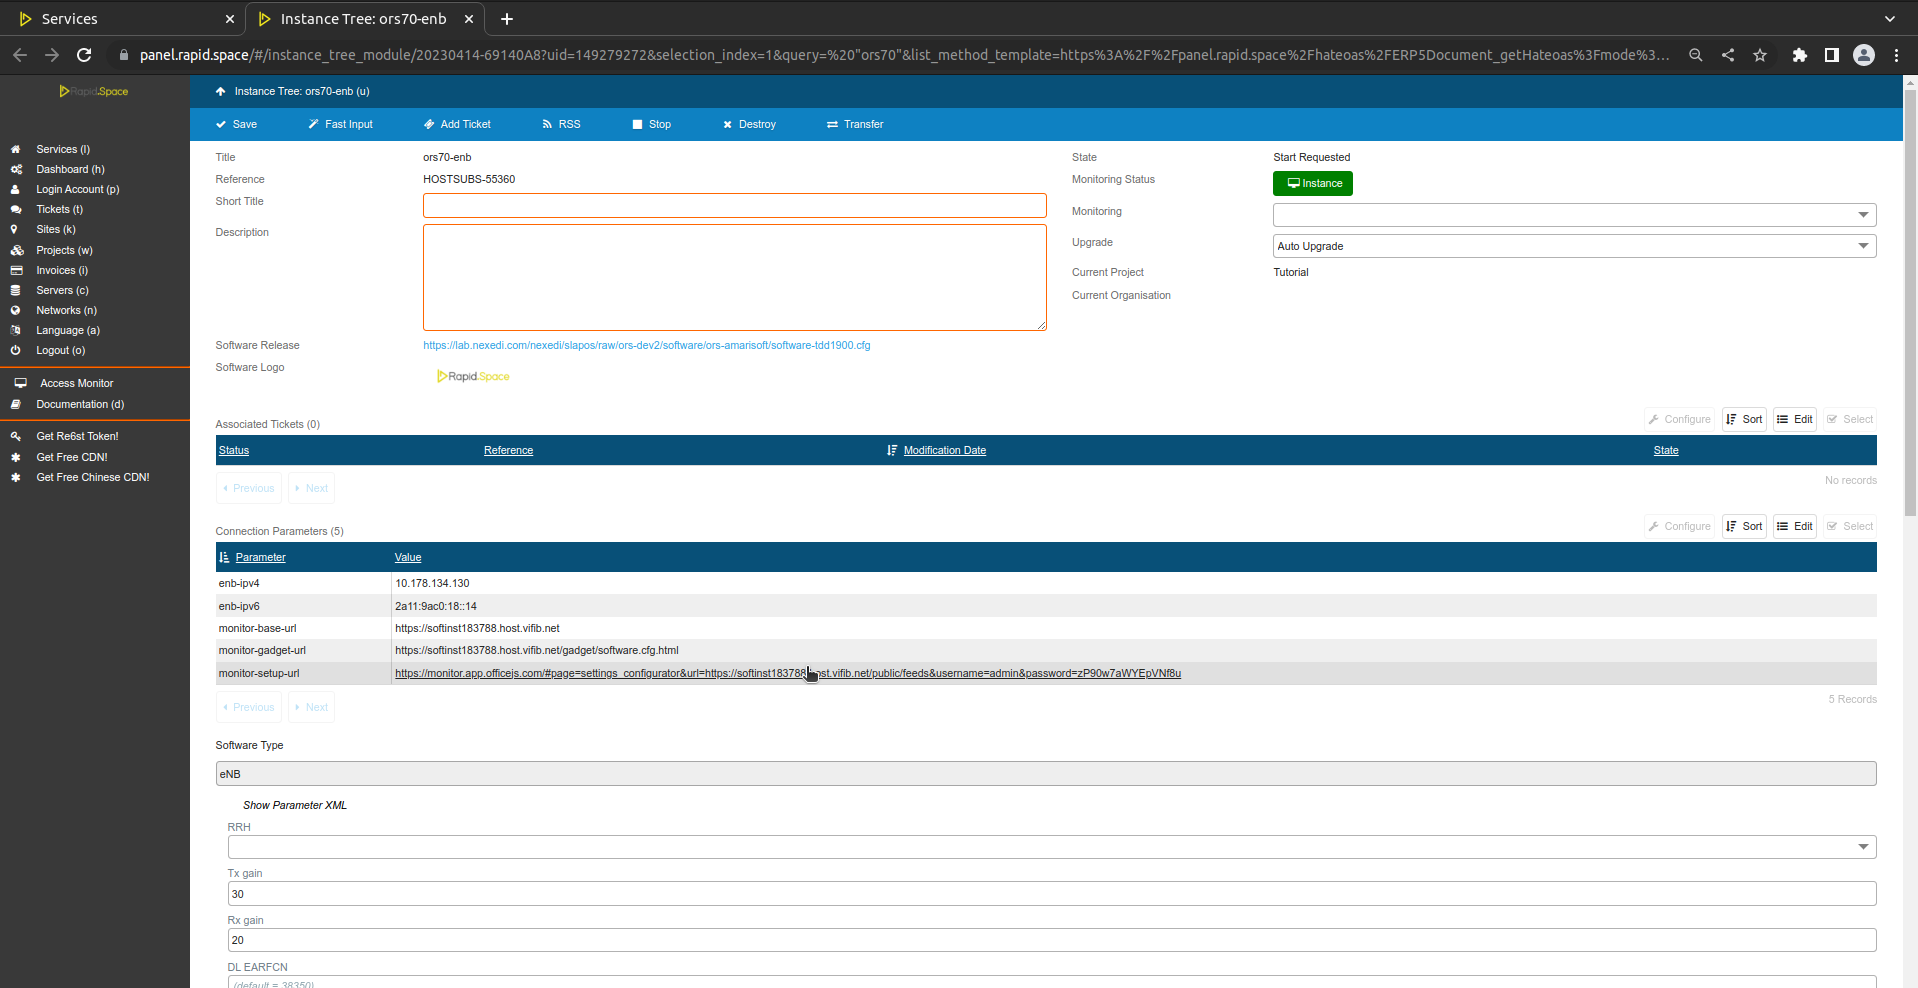
To investigate potential errors with the services or to get statistics you can use our monitoring app. Please go to your service page (by clicking on the service in the service section) and find the "monitor-setup-url" connection parameter, as shown on the screenshot. If the parameter is not present, please wait for 20 minutes after starting the service.
Monitor your BBU - Synchronization
Monitor your BBU - Synchronization
You will notice that when you enter the monitor App, the information of your ORS has been filled in automatically and started synchronisation. Once synchronisation finishes, the Monitor will load and display the list of Promises for your hosting subscriptions.
Before we get into the promise list, let's have a look at the App. The Monitor has a multiple-functions side panel:
- Promises: all promises of all services on all computers.
- Software Instances: all instances (hosting subscriptions) of all services on all computers.
- Instance Trees: all services from all computers (similar to Rapid.Space Panel).
- Monitor Configurations: all data sources (instances), loaded from master.
- Syncronize: update the monitor data by querying all services and crawling data.
- OPML Import / Export: used to import and export the current configuration.
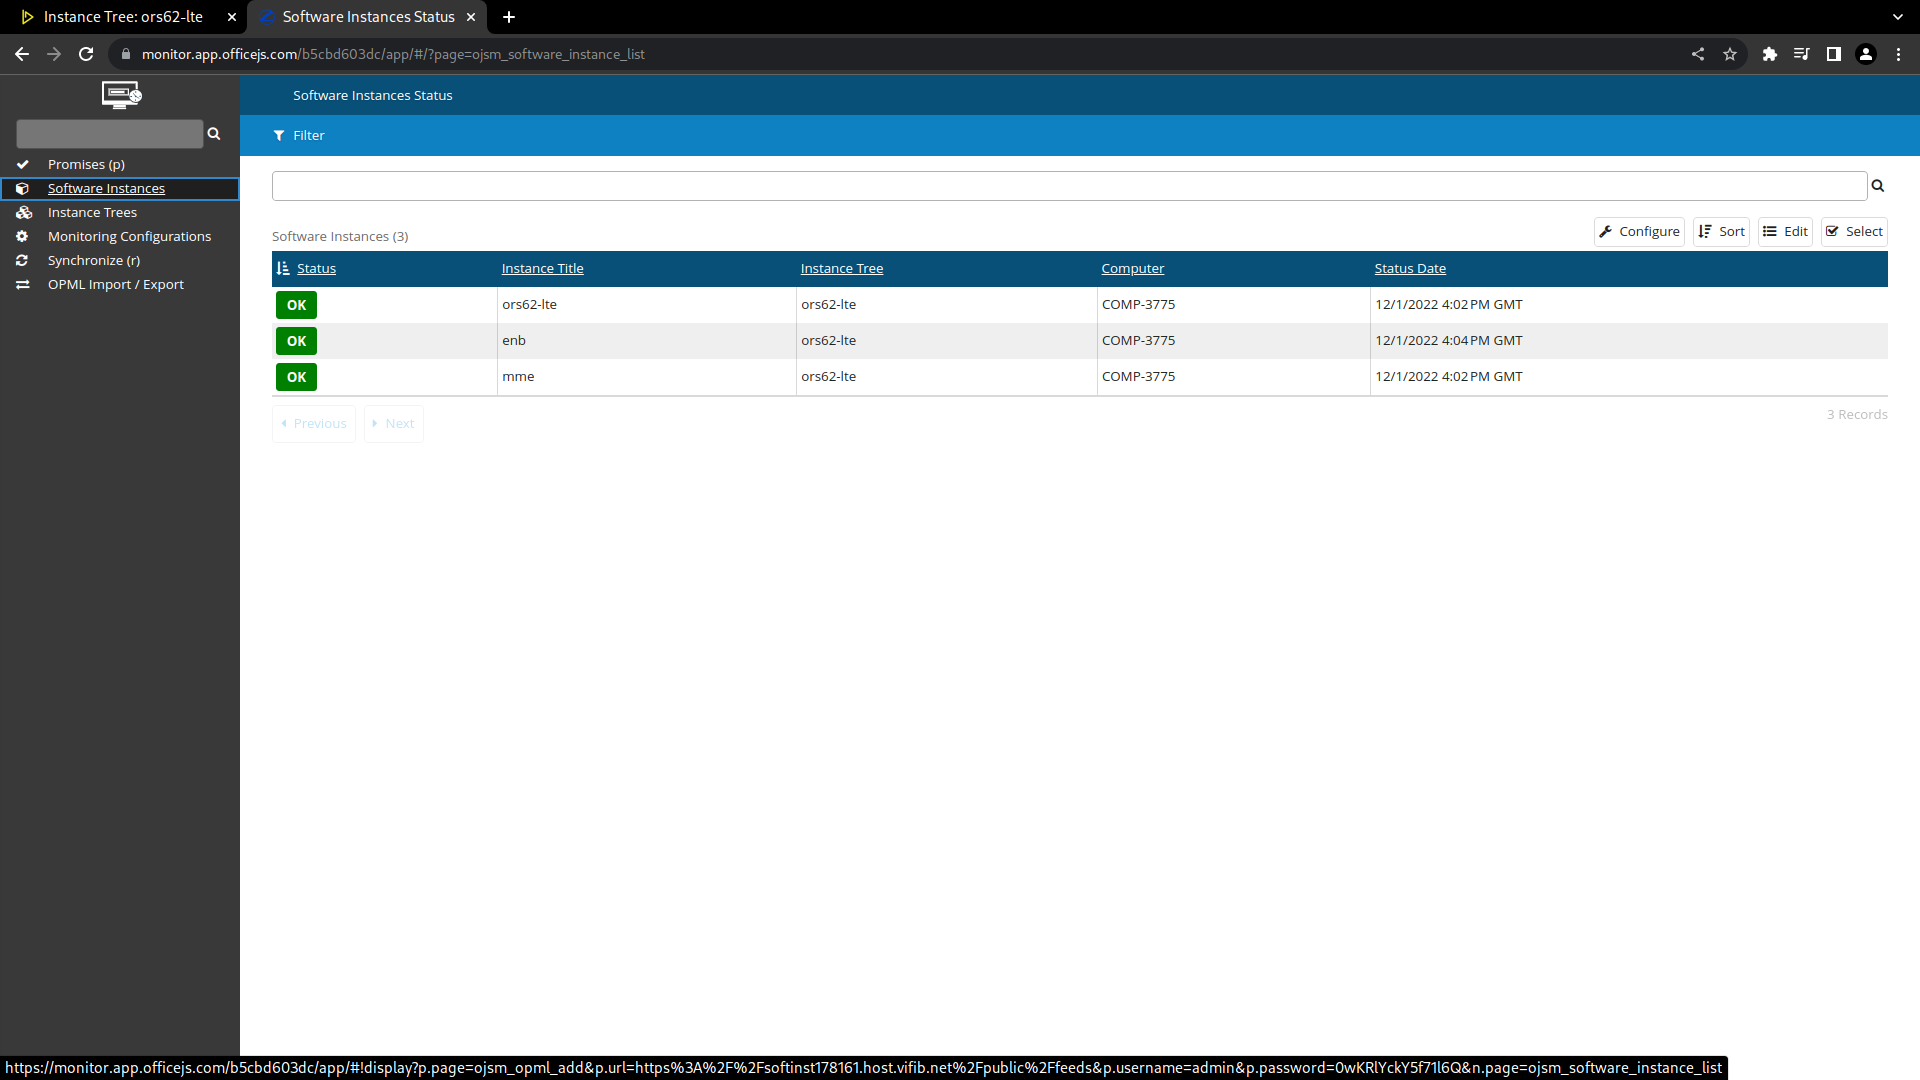
For instance you can click on "Software Instances" and then on the enb instance to get statistics regarding eNB.
Monitor your BBU - Promise List
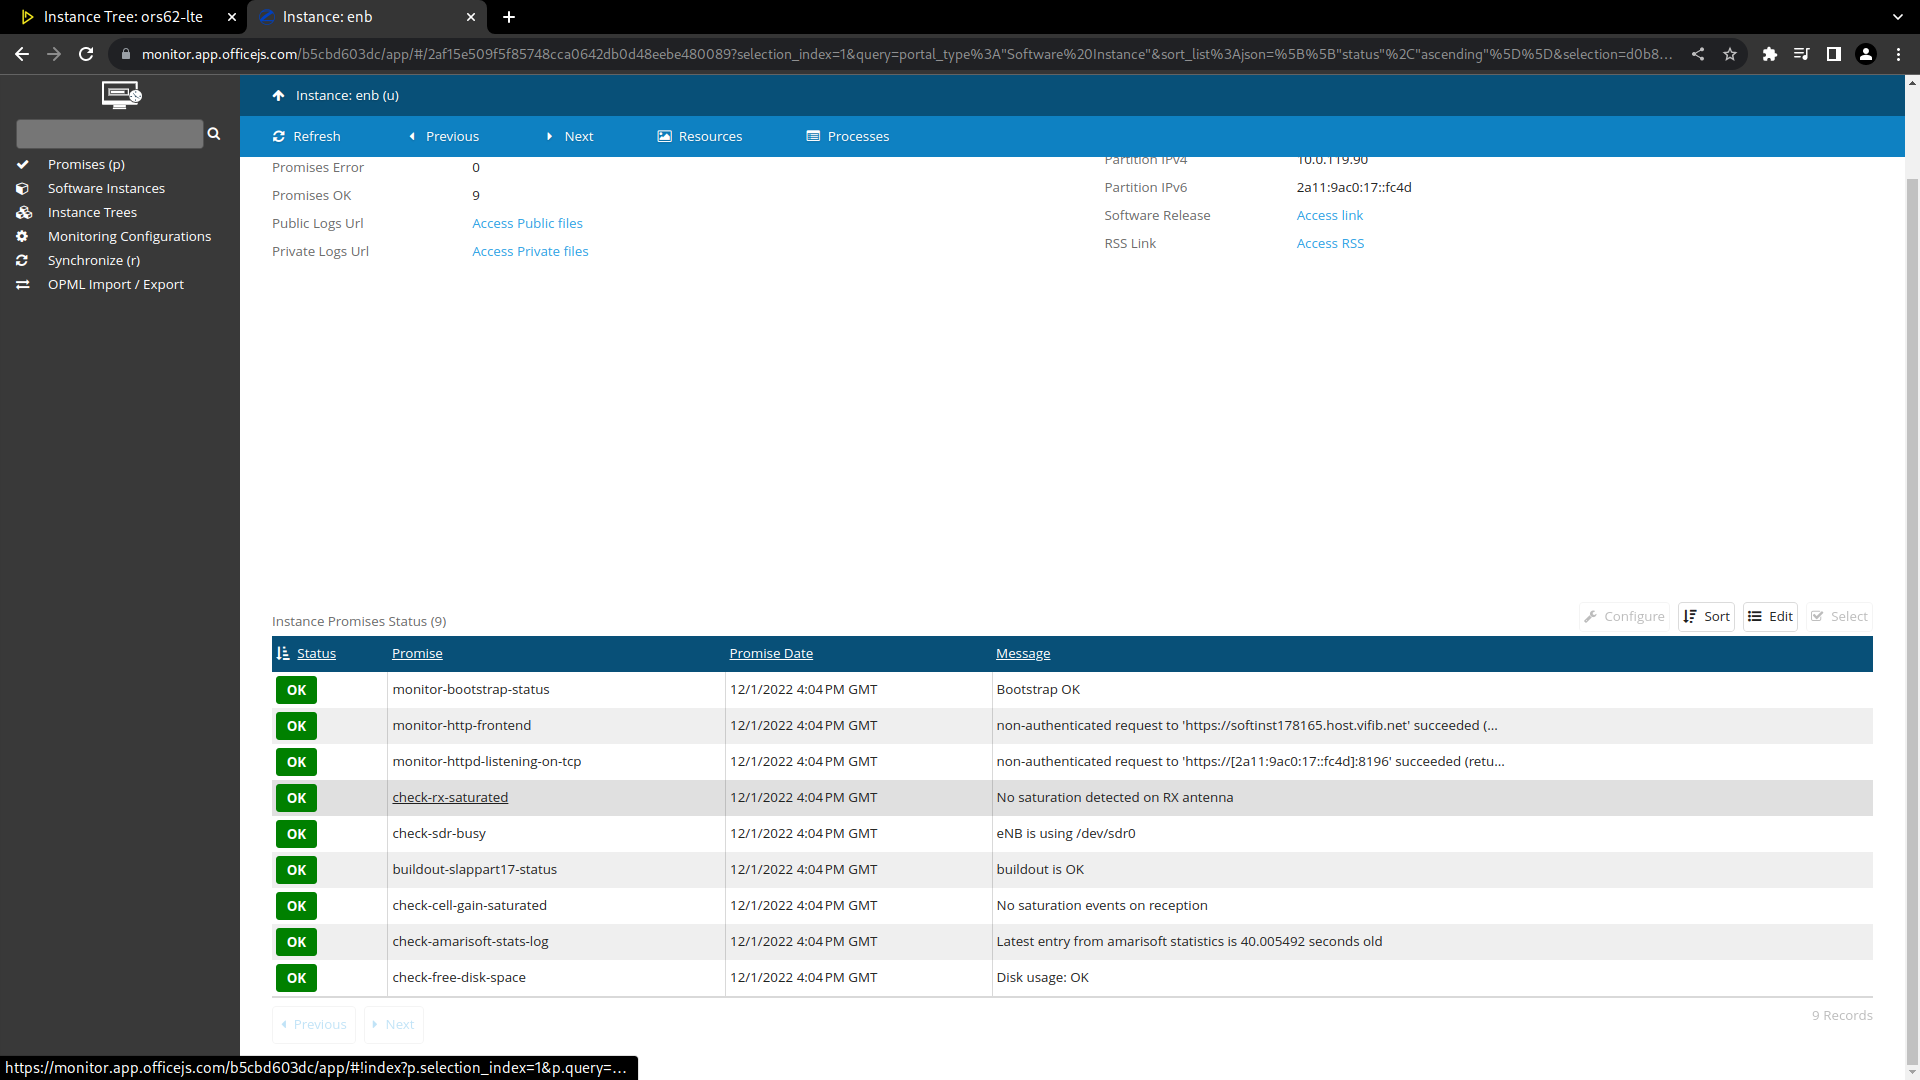
Here you can see the monitor page for the enb instance. On this page you can see the list of promises for this instance. Each promises checks a specific part of the instance is working correctly. Promises will appear orange or red if they are failing, which can help you investigate why your ORS is not working properly. Promises will also give you useful data.
Promises in Rapid.Space are executables doing arbitrary tasks and exiting with exit code 0 ("it works") or greater ("it doesn't work"). Everything in Rapid.Space is based on such Promises in order to automate the management of a Rapid.Space network. In case a Promise fails (eg. a computer not responding), a ticket will be created on the Rapid.Space Master in order for a user to follow up with this failing promise (more info in Understanding SlapOS Promises).
Monitor your BBU - Access BBU logs
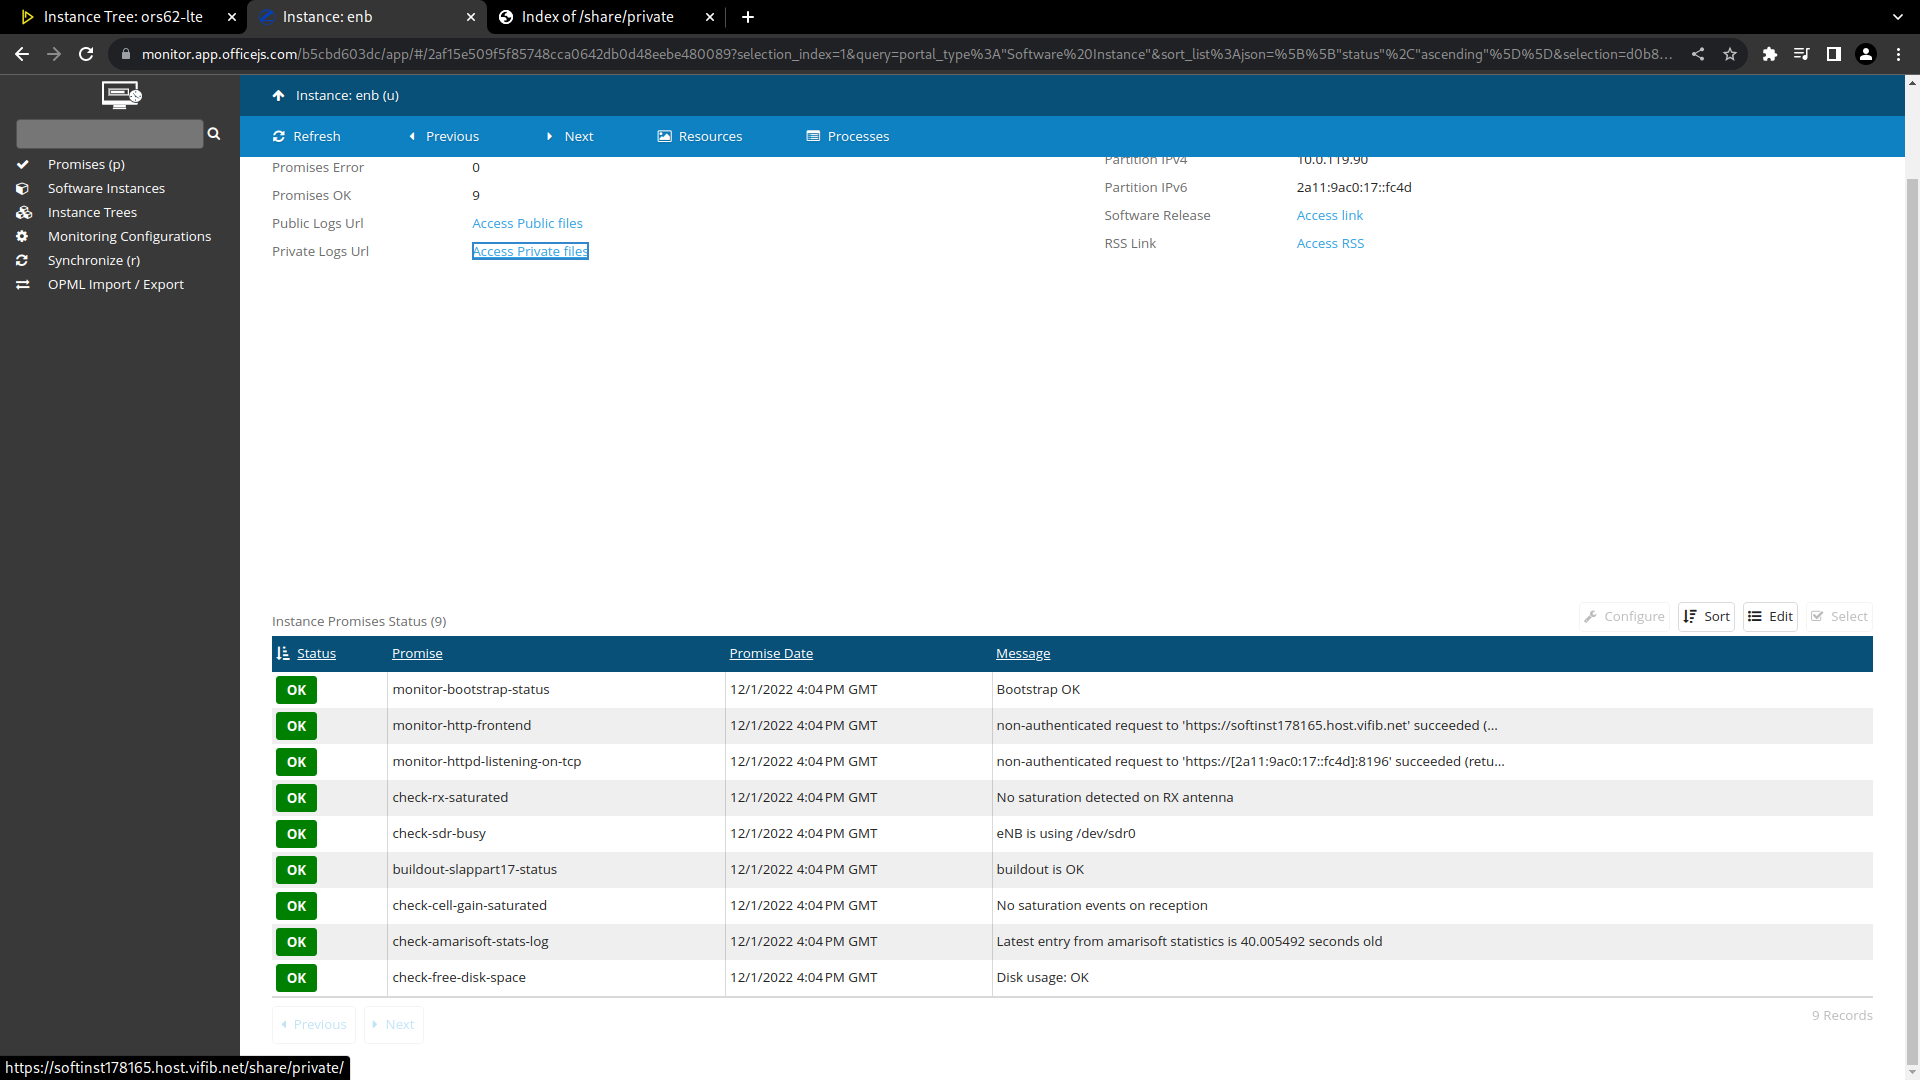
Please click on the "access private files" link to access the ORS logs.
Monitor your BBU - Access BBU logs
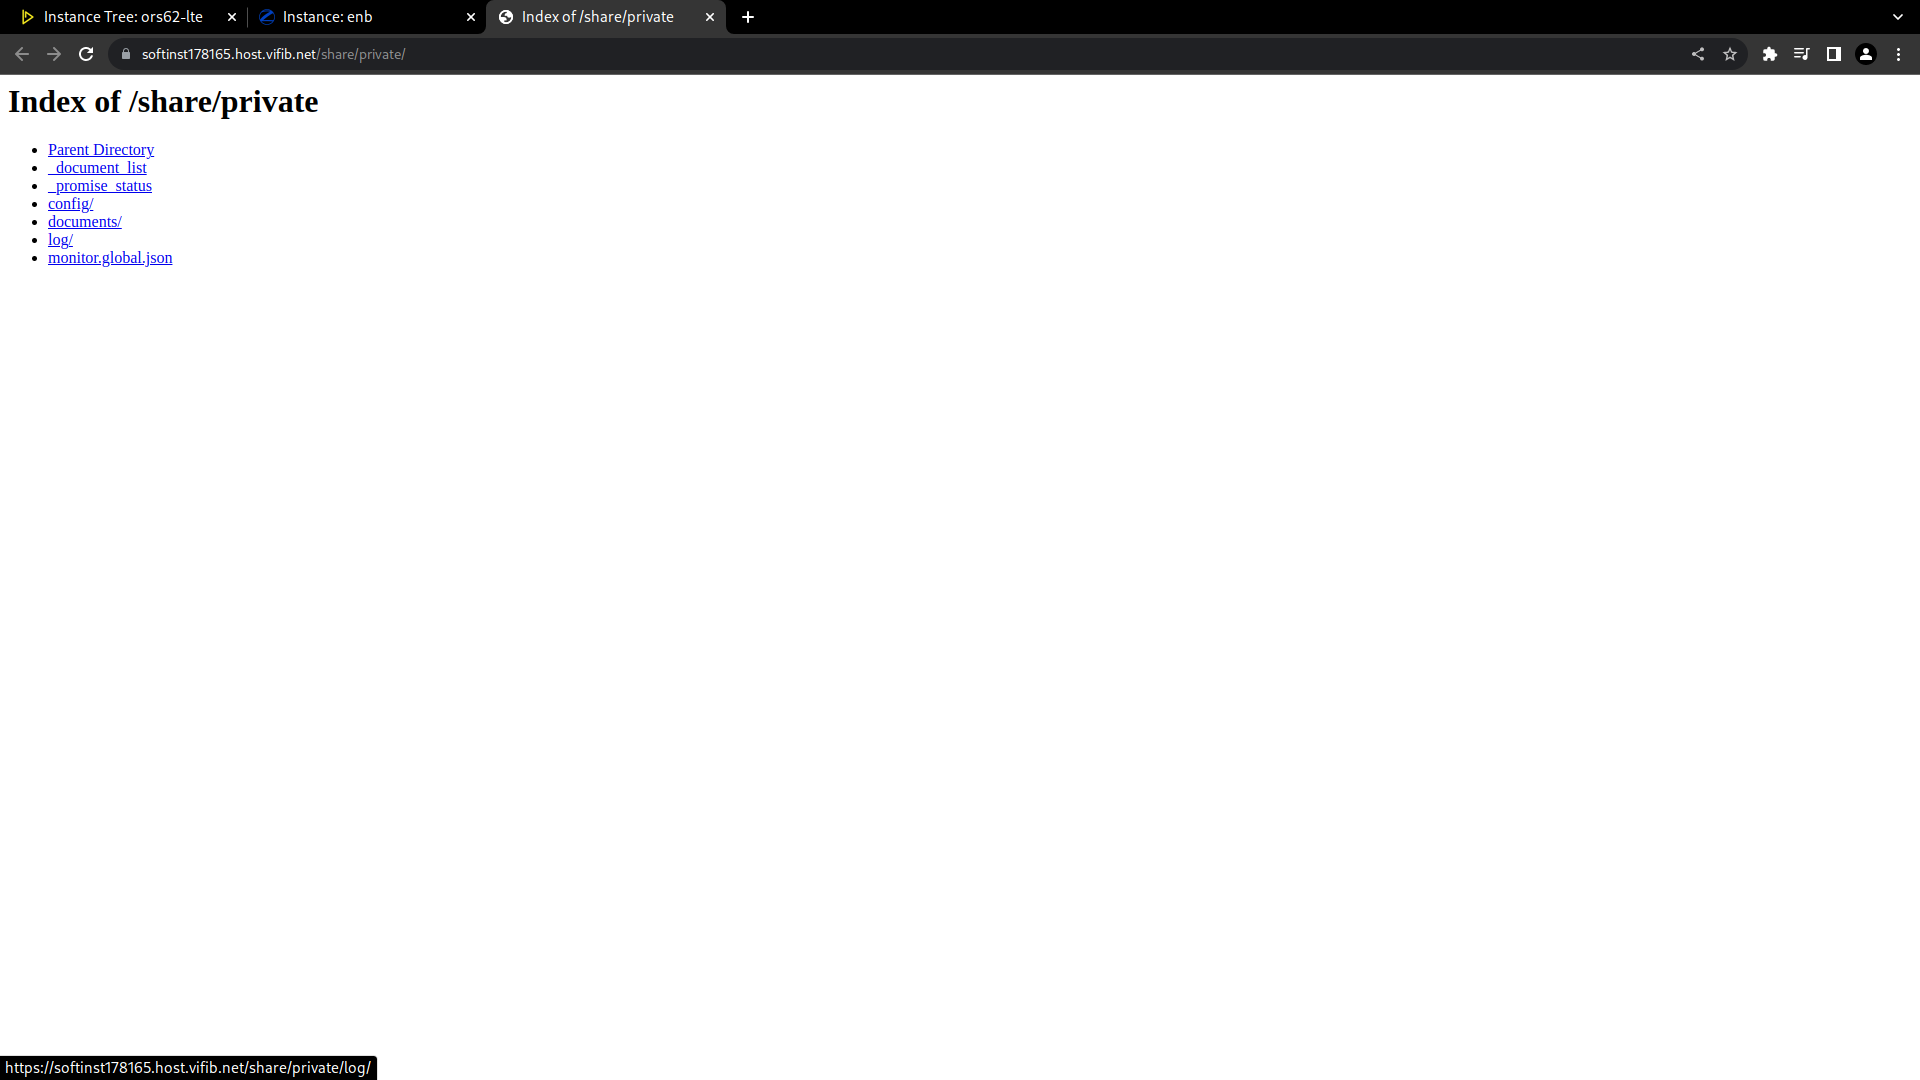
Next you can go the log folder.
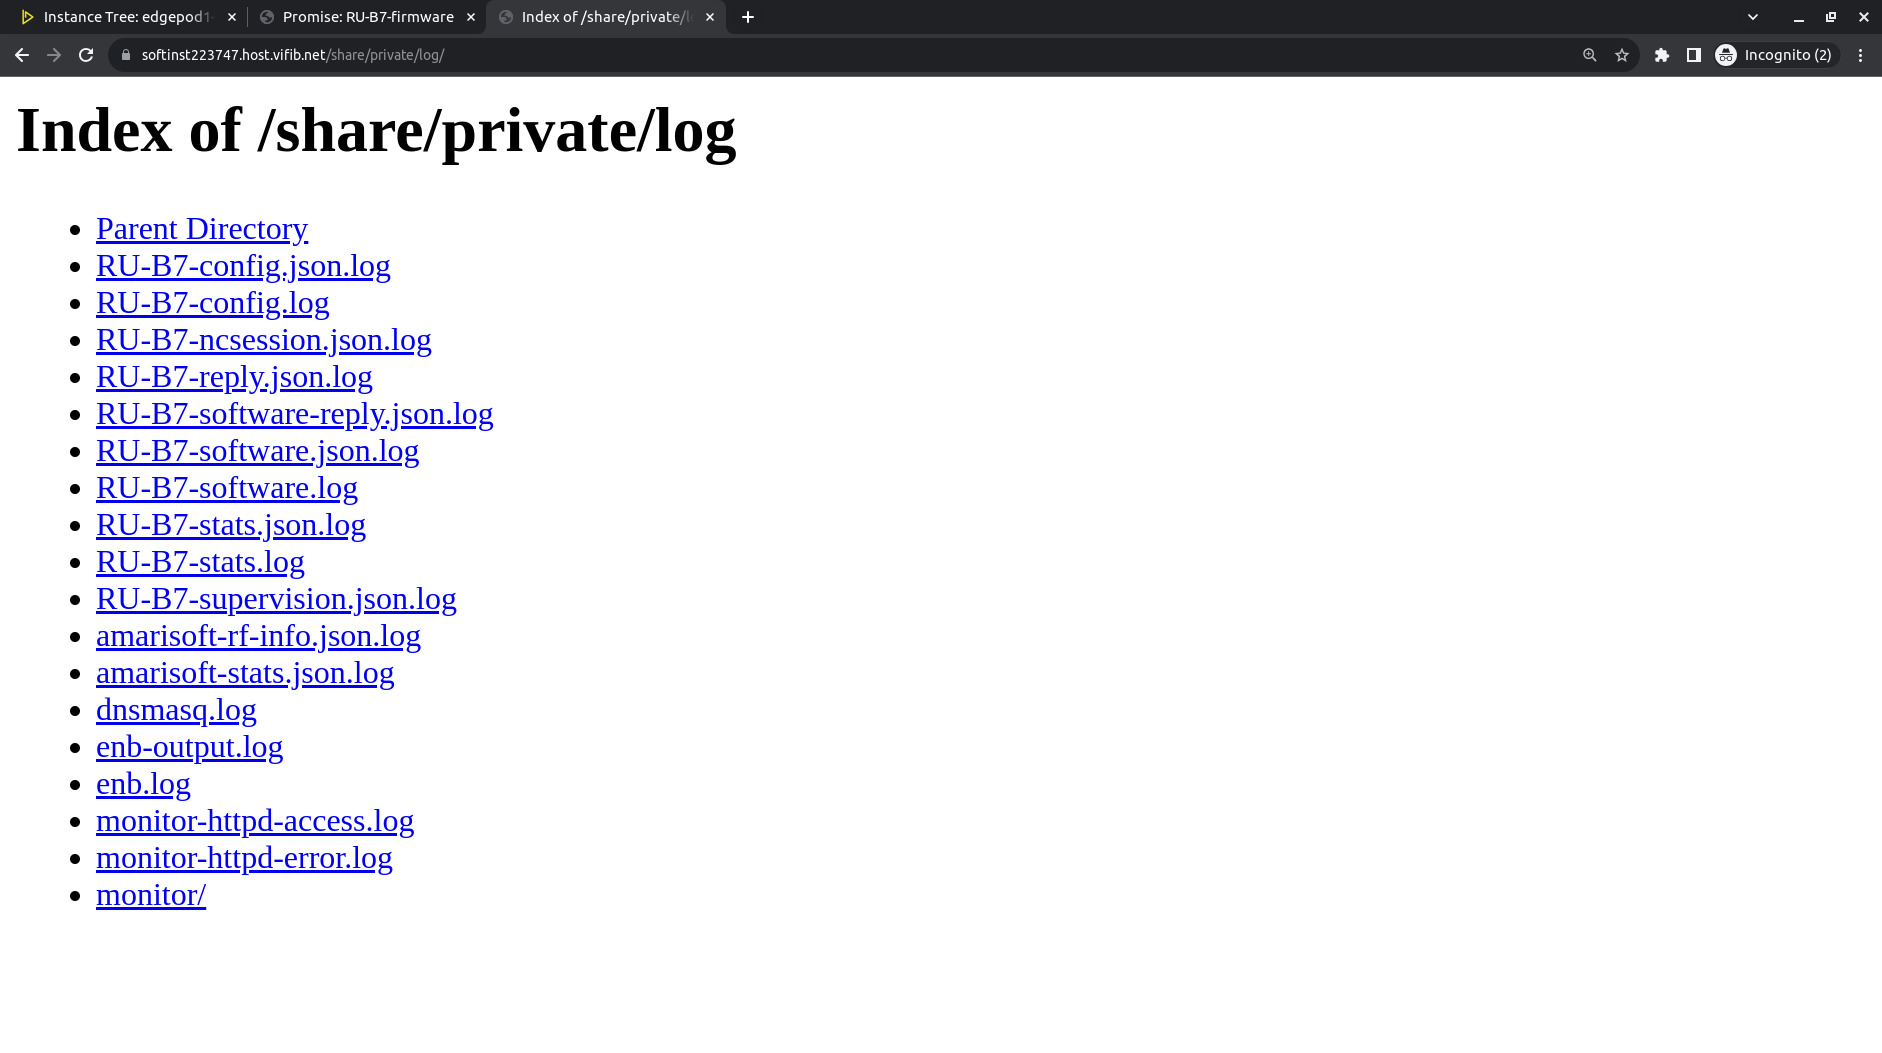
Monitor your BBU - Access BBU logs

Here are some useful entries from the log folder:
- amarisoft-stats.json.log: JSON dump of all radio statistics, such as RF power levels, saturation events etc...
- enb-output.log: Standard output from Amarisoft lteenb software
- enb.log: Log from Amarisoft lteenb software
- RU-XX-*.log: Log from RU
- monitor: Logs from the promises, can contain useful data
To learn how to interpret the logs, please refer to How To Interpret ORS Logs.
Monitor your BBU - Access BBU logs
After navigating to the monitor folder and then the promise folder, you will find logs from the promises. For instance, the "check-baseband-latency.json.log" JSON log will contain data about time for radio front end processing.
Monitor your BBU - Access BBU logs
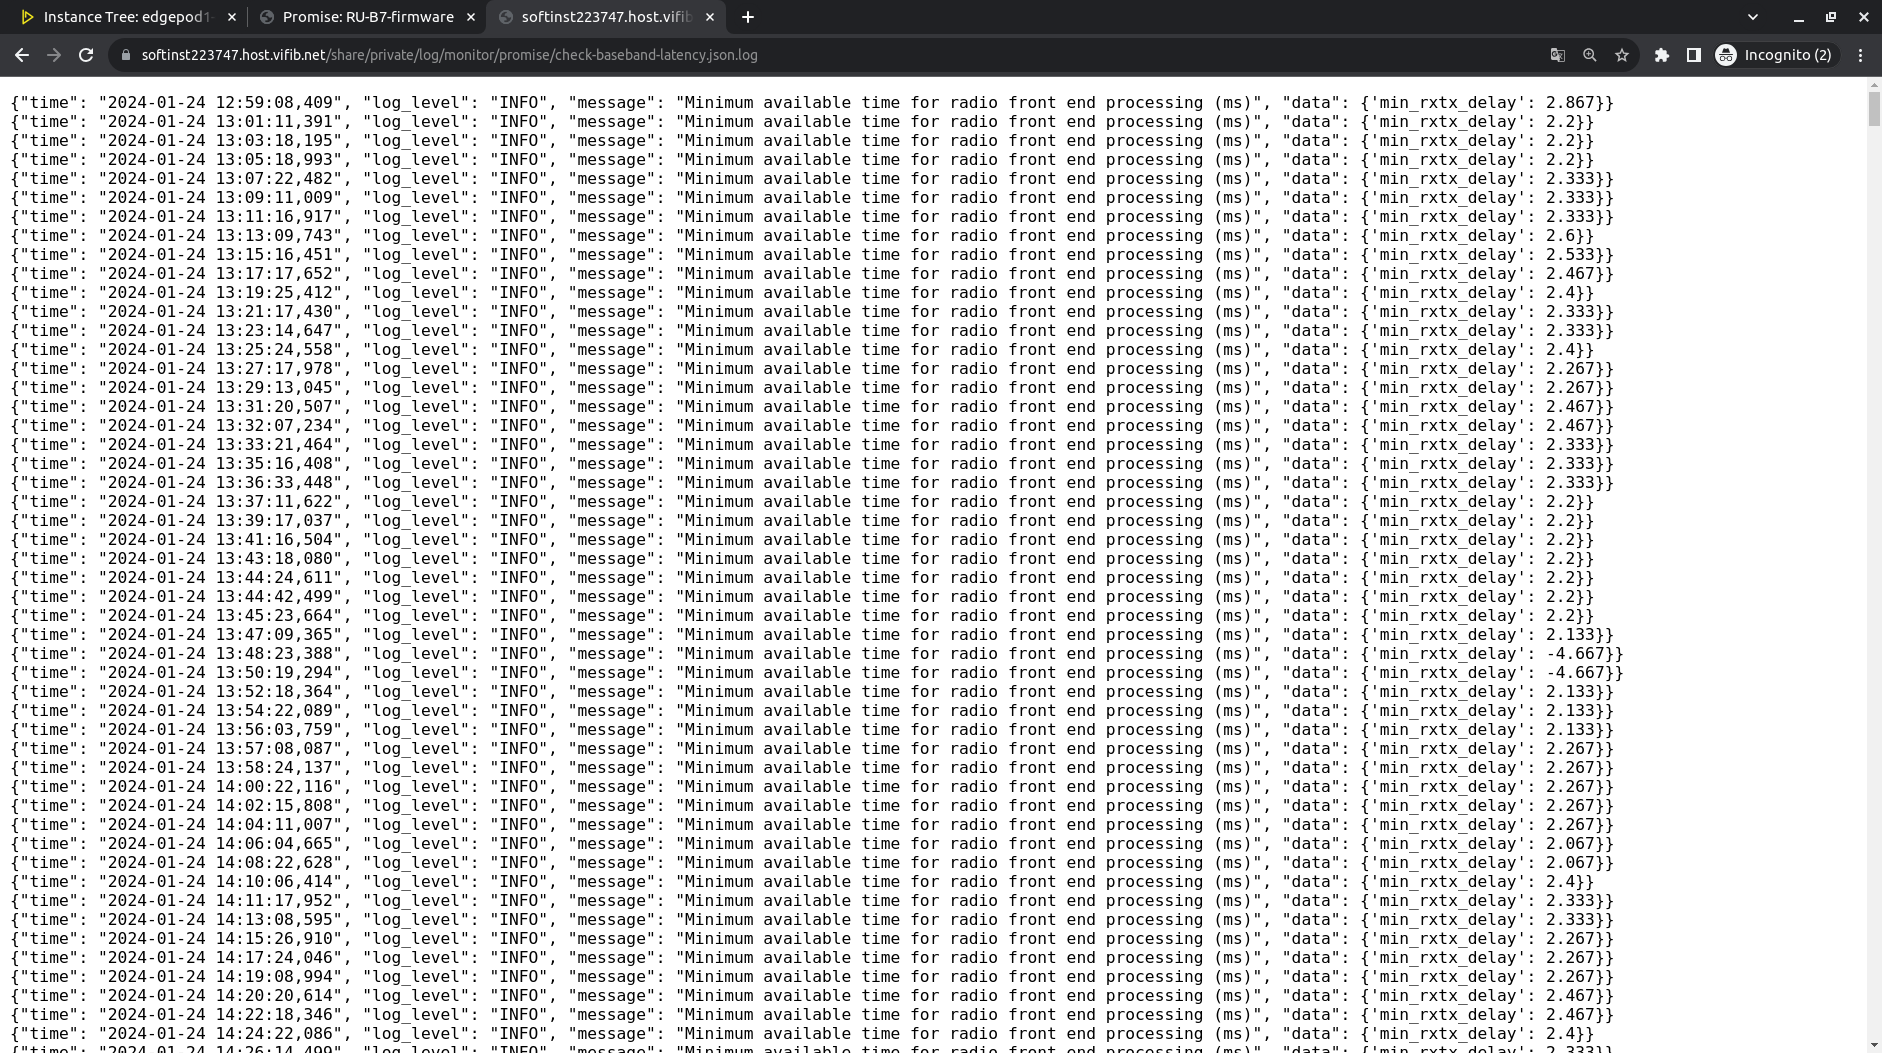
If "min_rxtx_delay" is less than 0, BBU doesn't have enough time on CPU to process radio front end. Please check CPU usage of the BBU.
Monitor your RU
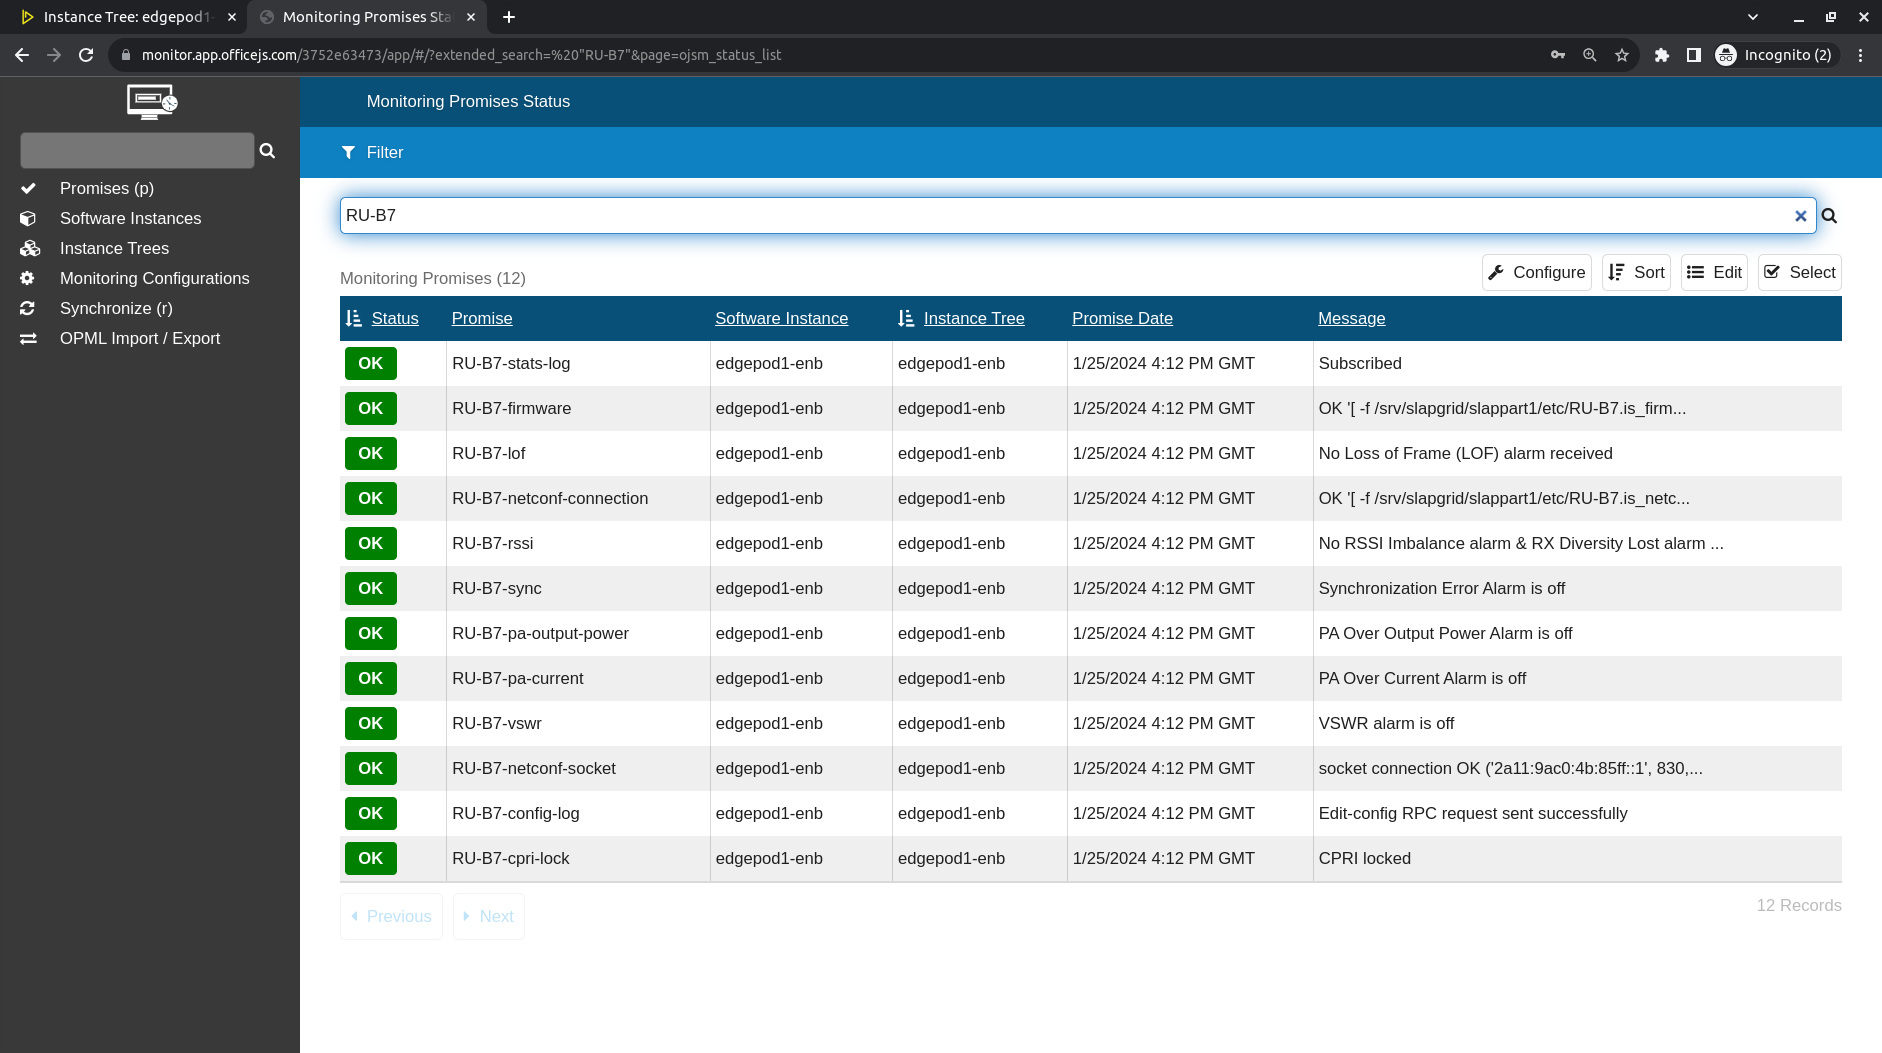
The promises related to RU named with "RU-*", monitored by NETCONF.